Key Takeaways
- XRP price recovery signals return as historical RSI divergence patterns reappear.
- On-chain data suggests selling pressure is fading, not accelerating.
- A past 33% XRP rally offers context, not guarantees, for 2026 expectations.
XRP has a way of keeping traders on edge. Just when sentiment cools and confidence starts slipping, the charts quietly begin telling a different story. That is exactly where the market finds itself now, with XRP price recovery signals returning after a sharp pullback.
If you have been watching XRP drift lower and wondering whether the worst is over, you are not alone. Recent technical and on-chain data suggest that XRP may be approaching a familiar turning point, one that previously led to a 33% rally. The big question is what that historical move could mean as the market looks toward 2026.
XRP’s Recent Pullback Put Into Perspective
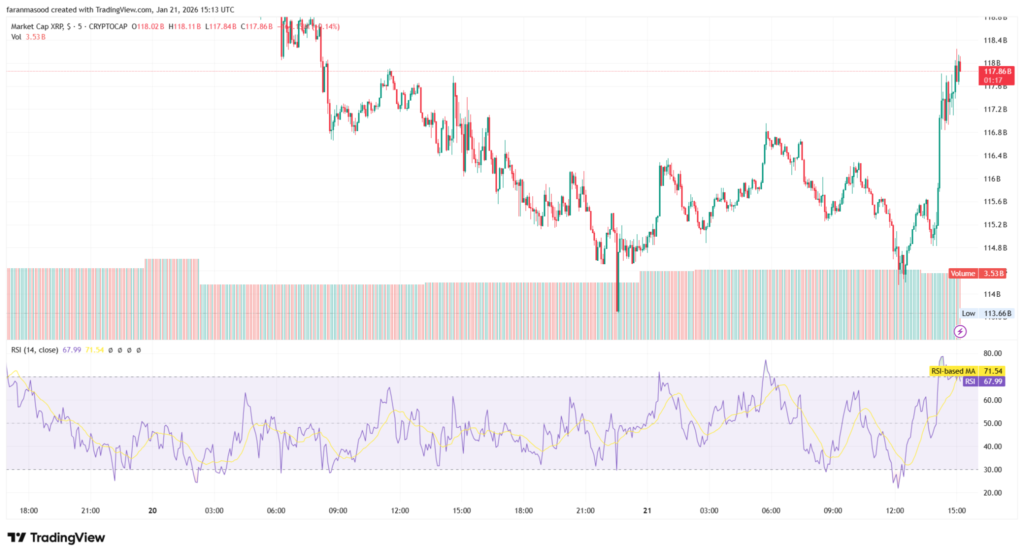
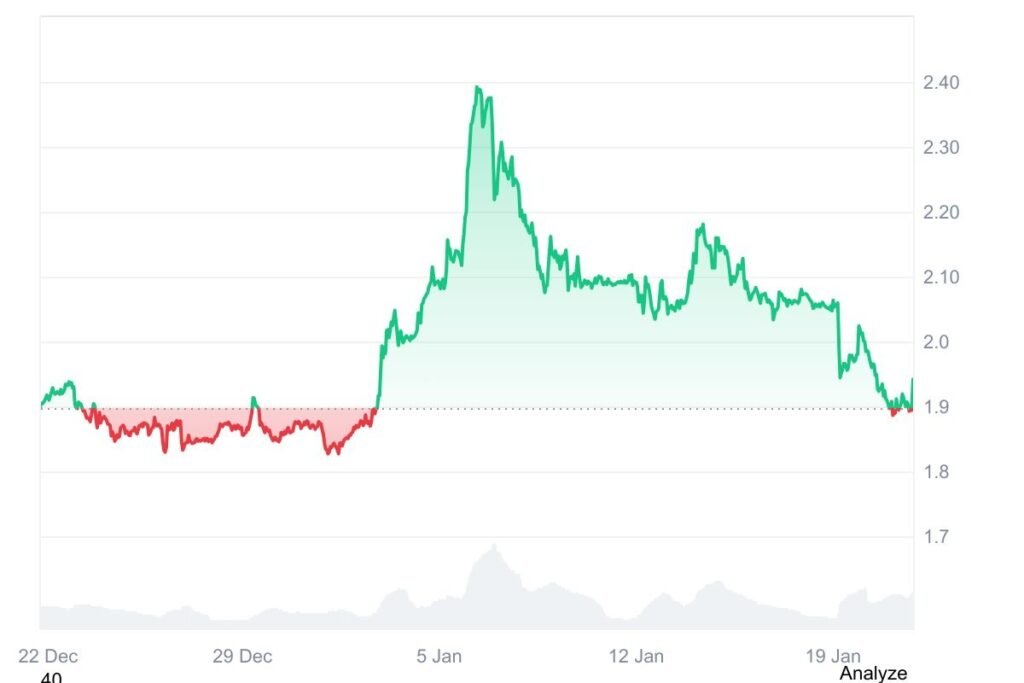
Over the past few weeks, XRP has struggled to hold momentum, slipping roughly 16% from its local highs and recently trading near the $1.90 level. For newer investors, this kind of move can feel unsettling. For seasoned market participants, corrections like this are often where the most useful signals emerge.
Despite the decline, XRP has not seen panic-level selling. Volume has remained controlled, and price action has been orderly rather than chaotic. That distinction matters because sustainable recoveries often begin when sellers quietly step aside rather than rush for the exits.
The Technical Signal Behind the XRP Price Recovery Signals Return
One of the clearest reasons analysts are paying attention right now is a bullish divergence forming on XRP’s daily chart. In simple terms, price recently made a lower low while the Relative Strength Index printed a higher low. This divergence suggests weakening downside momentum.
The last time XRP printed this exact setup, the token rallied approximately 33% in under a week. While markets never repeat perfectly, this historical context explains why the phrase XRP price recovery signals return is gaining traction again. Traders see the divergence not as a promise, but as evidence that selling pressure may be exhausting itself.
On-Chain Data Supports the Recovery Narrative
Technical signals tell part of the story. On-chain data fills in the rest. One key metric, Spent Coin Age, which tracks how actively coins are moving across different holding periods, has collapsed from roughly 83 million XRP to nearly zero. That is a six-month low.
This sharp drop suggests long-term and short-term holders alike are choosing not to move their coins. In other words, fewer people are selling into weakness. At the same time, Net Unrealized Profit and Loss data shows many recent buyers are sitting at a loss, reducing the incentive to sell further. Historically, this combination often aligns with stabilization phases before rebounds.
Key Price Levels That Matter Next
For XRP price recovery signals return to translate into real upside, certain price levels must be respected. The $2.00 mark remains a psychological barrier and an important near-term zone. Above that, the $2.14 to $2.16 range represents a dense supply cluster where sellers previously stepped in.
A decisive move above $2.17 would signal that XRP has absorbed overhead supply. If that happens, higher resistance levels around $2.41, $2.49, and even $2.89 come into view. On the downside, holding above $1.84 is crucial. A break below $1.77 would weaken the recovery thesis and reopen downside risk.
What a 33% Historical Rally Could Mean for 2026
It is tempting to fixate on the number itself. A 33% rally grabs attention, but its real value lies in what it represents. That move reflected a shift in momentum, sentiment, and participation. If XRP price recovery signals return in a similar fashion, it could mark the early stages of a broader trend reset heading into 2026.
Rather than expecting a straight line higher, investors should view this phase as a potential foundation. Sustained recoveries are built on confirmation, not hope. Watching how XRP behaves around key resistance levels will matter far more than chasing short-term price targets.
Final Thoughts
XRP price recovery signals return does not mean instant gains or guaranteed outcomes. It means the data is changing. Technical divergence, muted selling, and historical context together suggest the downside pressure may be easing.
For beginners, this is a reminder that markets often turn quietly. For experienced investors, it is an invitation to pay attention, manage risk, and let confirmation guide decisions. As 2026 approaches, XRP’s next move may say more about market structure than short-term price excitement.
Frequently Asked Questions
What does XRP price recovery signals return mean?
It refers to technical and on-chain indicators suggesting XRP may be transitioning from a corrective phase into a potential recovery.
Has XRP rallied 33% before after similar signals?
Yes, the last time a comparable RSI divergence appeared, XRP rallied roughly 33% within a short period.
Is a XRP rally guaranteed in 2026?
No. Historical patterns provide context, not certainty. They highlight probabilities, not promises.
What price levels should XRP investors watch now?
Key levels include $2.00, $2.17 on the upside, and $1.84 and $1.77 on the downside.
Are on-chain metrics reliable for XRP analysis?
On-chain data is most effective when combined with technical analysis and broader market context rather than used alone.